
Introduction
-
Confusion Matrix : is composed of four elements: TP, TN, FP, and FN. T/F in the front indicates whether the model answered correctly, and P/N in the back indicates the predicted value of the model.
-
Positive and Negative should be interpreted as predicted values from the model’s point of view, excluding the modeler’s subjectivity. For example, the predictive value of having cancer is a negative, but for the model, it is only closer to 1 (positive) than 0 (negative).
-
It is intuitive to read from the back due to the word order difference between English and Korean.
-
TP (True Positive) : The prediction of the model is postive and it is true (answer is positive)
-
TN (True Negative) : The prediction of the model is negative and it is true (answer is negative)
-
FP (False Positive) : The prediction of the model is postive and it is False (answer is negative)
-
FN (False Negative) : The prediction of the model is negative and it is False (answer is positive)
-
-
Even if there are multiple classes, it is not very different. For example, in the case of the apple class:
- TP is 7, TN is 1+3+2+3, FP is 8+9, and FN is 1+3
-
1. True Positive Rate (TPR, Sensitivity, Recall)
-
The probability of a positive prediction, conditioned on truly being positive.
- Ex1. Proportion of predicted cancer among patients who actually had cancer
$$ \frac{TP}{P} = \frac{TP}{TP+FN} $$
2. True Negative Rate (TNR, Specificity)
- The probability of a negative prediction, conditioned on truly being negative.
- Ex2. Proportion of predicted normal out of actual normal people
$$ \frac{TN}{N} = \frac{TN}{TN+FP} $$
3. False Positive Rate (FPR, Fall-out)
- The false positive rate is calculated as the ratio between the number of negative events wrongly categorized as positive (false positives) and the total number of actual negative events (regardless of classification).
$$ FPR = \frac{FP}{N} = 1-TNR = 1-Specificity $$
3. Positive Predictive Value (PPV, Precision)
-
The probability of a true positive prediction, among every positive predictions
-
The ratio of truely cancer among predicted cancer
-
If “Sentivity” is from the point of view of the answer (label), “Precision” is the interpretation from the point of view of the model
-
$$ \frac{TP}{TP+FP} $$
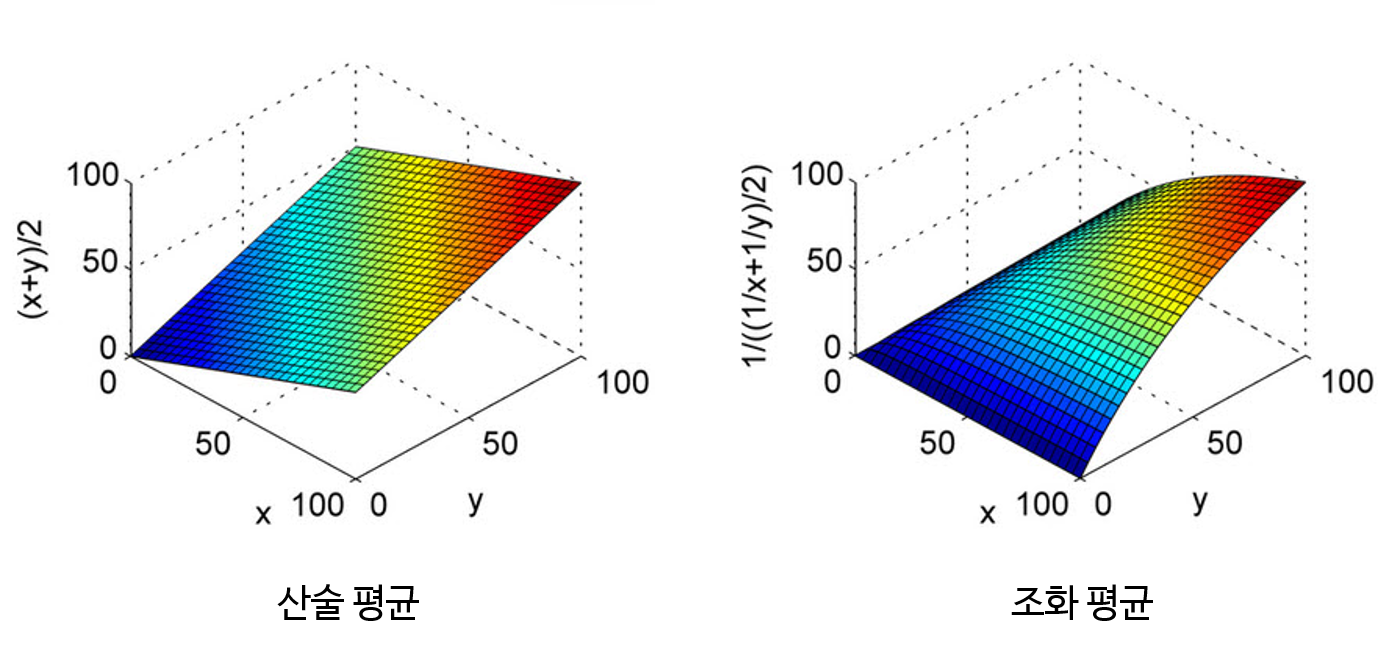
5. F1-Score
- F1-Score : The harmonic average of Precision and Recall (harmonic average : the more unbalanced the value used for average calculation, the more the penalty is applied so that the average is calculated closer to the smaller value)
- Micro (Averaged) F1 : is calculated by considering the total TP, total FP and total FN of the model. It does not consider each class individually, It calculates the metrics globally.
- Macro (Averaged) F1 : calculates metrics for each class individually and then takes unweighted mean of the measures.
- Weighted F1: it takes a weighted mean of the measures. The weights for each class are the total number of samples of that class.
- Reference
$$ 2 \times \frac{Precision \times Recall}{Precision + Recall } $$
6. ROC (Receiver Operating Characteristic) Curve
- Visualization of changes in Recall(TPR) and Fall-out(FPR) by threshold